Summary
For investors, 2021 is off to a good start. That doesn't mean the first three months of the year have been smooth sailing. Despite hitting all-time highs, financial markets saw some big swings during the first quarter. The volatility might have made you nervous. That's understandable. Keep in mind that big swings are normal. Stocks don't always go up.
The gains in the prices of stocks, housing, and cryptocurrencies have caused some investors, economists, and financial pundits to bring up the dreaded b-word, bubble, again and again. Is this a bubble? I don't know. No one knows. Anyone who tells you they know this is a bubble, and when it will burst, is lying.
Here's what we do know, with at least a reasonable degree of certainty:
The COVID vaccines continue to be produced, shipped, and processed throughout the U.S. and the world
Vaccinated people will be able to slowly resume normal activities
Employment will pick up
The economy will continue to recover
Unless your life situation or goals have changed, you should stick to your financial plan, which includes maintaining a properly diversified portfolio of investments
First Quarter 2021 Numbers
The average diversified U.S. stock fund, which is a better measure of how we invest than the S&P 500 or the Dow, gained about 8.5% during the first quarter of 2021. Small cap stocks continued to shine, outperforming all other investment categories during the quarter. Investors, optimistic about a recovery, pushed $78 billion into U.S. stock funds.
International stocks were also up for the quarter: The average diversified international stock fund rose about 3.5%. Investors demonstrated confidence in international stocks funds by investing a little over $27 billion in those funds during the quarter.
The average intermediate-term bond fund declined nearly 3.0% during the first quarter. Despite the decline, investors plowed nearly $2255 billion into bond funds over the three-month period.
Returns By Category
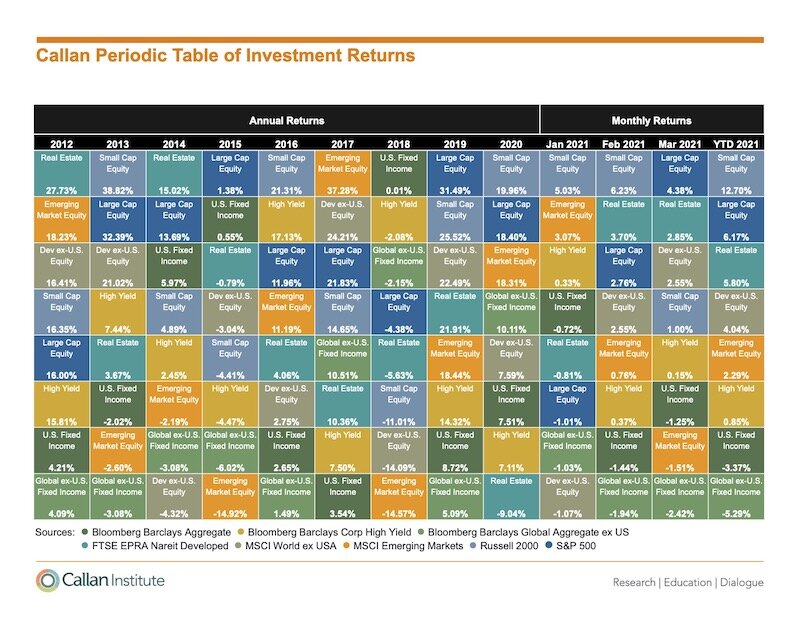
Need a magnifying glass to read this? No problem. Here's a link to a PDF of this chart.
The chart above provides a high-level view of how the asset categories performed for the years 2012 to 2020, January through March 2021, and year-to-date 2021.
I love this chart and always look forward to seeing the updated version. Two takeaways:
Notice any patterns? If you answered "yes", we need to talk because your brain operates on a different level than mine. It's nearly impossible to consistently predict which categories will perform best from year-to-year or month-to-month.
This chart is Exhibit A for why it's prudent to build diversified portfolios. Sadly, diversification means you're always having to say you're sorry because it's rare for every category to produce positive returns.
Market Volatility and Investing

Need a magnifying glass to read this? No problem. Here's a link to a PDF of this chart.
In the Summary I noted the financial markets were volatile during the first quarter of 2021. In order to reinforce my comments about (a) ignoring short-term volatility and (b) maintaining a well-diversified portfolio, I'm sharing a chart from BlackRock.
The chart shows 1-year returns of stocks from 1930 - 2020. The obvious takeaway is that there are far more years with positive returns than negative. Less obvious, but perhaps more important to keep in mind, is that for any given year the markets probably had wild swings from day-to-day. Hang on and stick to your plan.
Finally, a client asked me to include a reference to WandaVision in my next post. So.....